0011
Pseudo Test-Retest Evaluation of Sparse DCE-MRI of Brain Tumor1Department of Electrical and Computer Engineering, University of Southern California, Los Angeles, CA, United States, 2Applications and Workflow, GE Healthcare, Calgary, AB, Canada, 3Department of Radiology, University of Calgary, Calgary, AB, Canada, 4Department of Clinical Radiology, Keck School of Medicine of University of Southern California, Los Angeles, CA, United States, 5Departments of Radiology, and Clinical Neurosciences, University of Calgary, Calgary, AB, Canada
Synopsis
Brain DCE MRI suffers from poor spatial coverage, lack of standardization, and insufficient quantitative understanding of the extent of (physical) uncertainty in the measurements. Here, we attempt to overcome these by providing a fully automated high-resolution whole-brain DCE MRI pipeline with no user interaction. Prospective test-retest repeatability evaluation is challenging, therefore we employ a surrogate: multiple post-treatment time points in stable brain tumor patients. The proposed framework is able to yield consistent vascular input functions and tracer kinetic parameter histograms for repeated visits.
Introduction
Dynamic contrast enhanced MRI (DCE MRI) enables assessment of neurovascular parameters and provides biomarkers for brain tumor response to therapy.1 Brain lesions commonly exhibit large regions of spatial heterogeneity, narrow enhancement rims around necrotic cores, or spread into smaller metastases across the entire brain.2 Effective biomarkers therefore require high resolution whole-brain DCE MRI protocols and accurate, precise, and reproducible tracer-kinetic (TK) parameters.1,3-6 Despite efforts from RSNA-QIBA DCE-MRI task force and other groups, clinical protocols lack standardization and uncertainty of the TK parameters remains unknown. This prevents the design of reliable biomarkers for individualized therapy and clinical trials.1,3,7-9 In this work, we demonstrate a fully automated high-resolution whole-brain DCE MRI pipeline with no user interaction. We evaluate the repeatability of our proposed pipeline using multiple post-treatment time points in brain tumor patients.Methods
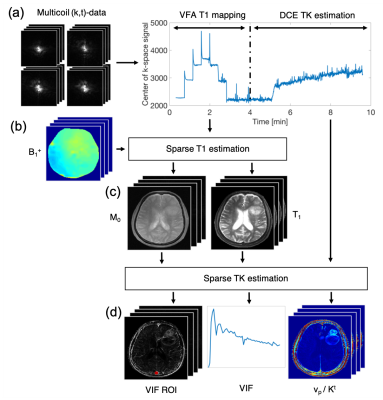
Guo et al.10 recently demonstrated joint estimation of high spatial resolution, whole brain TK parameter maps and patient specific vascular input functions (VIF) from highly-undersampled raw k-space data. We extended this framework with an automated delineation of brain vessels based on common image-time-series features in the literature, i.e., time-to-peak, full-width-at-80%-maximum, and enhancement relative to precontrast.11-13 We first trimmed the outermost voxels to account for possible partial volume averaging. We then chose the vessel with the largest principle axis in the S/I direction. The final VIF was estimated jointly from all complex-valued image voxels within the VIF regions-of-interest (VIF ROI).14 We assumed concentration-time-curves to follow the extended Tofts-Kety model.15,16 To account for bolus transit delay we fitted each voxel three times with time shifted versions of the AIF and select the best fit. Baseline proton density and T1-maps were estimated at matching spatial resolution and coverage from sparsely sampled, B1-corrected variable flip angle T1-mapping.17 The pipeline and imaging parameters are summarized in Figure 1.Repeatability studies require non-standard of care exams with contrast injection, which are hard to justify and execute. We estimated repeatability of the proposed pipeline on ten high-grade glioma brain tumor patients, who receive standard of care exams every two months. In each patient we analyzed two consecutive exams where minimal tumor progression occurs to assess repeatability. Patients provided institutionally approved informed consent.
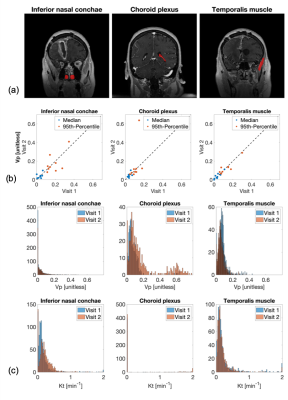
Regions-of-interests (ROI) were manually drawn on three different enhancing tissue types: left and right inferior nasal conchae which are lined by the nasal mucosa, the choroid plexus, and the temporalis muscle. Regions were not drawn on tumor tissue due to postresection ambiguity and possible tumor progression. The advent of high spatial resolution DCE MRI protocols has increased interest in histogram analyses and histogram derived statistics to analyze tumor heterogeneity.18 We compared histograms for TK parameters vp and Kt and median and 95th-percentiles for vp.
Results
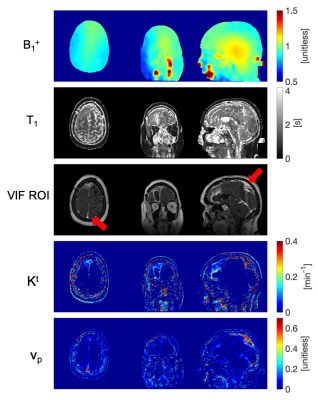
Figure 2 illustrates spatial maps of B1+ inhomogeneity, baseline T1, VIF ROI location, and TK parameters generated by the fully automated DCE MRI pipeline for a representative tumor case.Figure 3a shows ROIs for the three tissue types that are used for repeatability evaluation. The correlation plots in Figure 3b show histogram statistics of vp estimation in good agreement for all tissue types, tumor cases, and visits. While histograms for vp and Kt in Figure 3c are in good agreement for nasal conchae and temporalis muscle, there is substantial deviation between the visits for the choroid plexus.
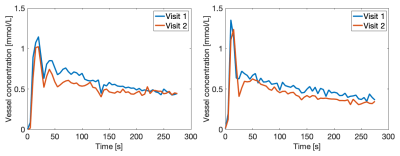
Figure 4 shows good agreement of VIFs at visit 1 and 2 for two representative tumor cases.
Discussion
While Quantitative DCE MRI can look back at substantial progress in the past, lack of standardization poses one of the biggest present challenges preventing DCE MRI from full clinical translation and further development. RSNA QIBA is currently addressing this by updating the profile with recommendations for standardized DCE MRI.19Stroke MRI assessment has illustrated how fully automated software packages provide a powerful way to standardize post-processing and pave the road to clinical deployment of a technology.20 We demonstrate a DCE MRI framework that does not rely on user interaction to estimate high-resolution, whole brain TK parameter maps. We further evaluate repeatability of the framework in a study that was performed with data from a single center, vendor, and field strength to keep the data acquisition and protocol as consistent as possible.
Brain tumors present one of the main application areas of DCE MRI, and test-retest studies on brain tumor patients are rarely done due to severity of the disease. Two limitations of this study are the pseudo-test-retest evaluation and the lack of evaluation of TK parameter estimation in this target tissue. While we plan to improve the ROI delineation on tumors in collaboration with specialists at our hospital, it remains on open question if pseudo-test-retest provides a valid and informative surrogate for test-retest evaluation.
Conclusion
We demonstrate a fully automated DCE MRI reconstruction and modeling pipeline offering high spatial and temporal resolution and full brain coverage. This includes fast pre-contrast T1 estimation, automated VIF extraction, and model-based TK mapping. The protocol is able to estimate consistent VIFs and tracer kinetic parameter histograms in several tissues.Acknowledgements
We acknowledge funding from the National Institutes of Health (Grant R33-CA225400) and the Canadian Cancer Society (Grant 704210). We also thank Samuel R. Barnes for providing Gpufit, fast GPU-accelerated fitting to tracer-kinetic models.16References
1. Cao Y. The Promise of Dynamic Contrast-Enhanced Imaging in Radiation Therapy. Semin. Radiat. Oncol. 2011;21:147–156 doi: 10.1016/j.semradonc.2010.11.001.
2. Guo Y, Lebel RMM, Zhu Y, et al. High-resolution whole-brain DCE-MRI using constrained reconstruction: Prospective clinical evaluation in brain tumor patients. Med. Phys. 2016;43:2013–2023 doi: 10.1118/1.4944736.
3. Jain RK, Duda DG, Willett CG, et al. Biomarkers of response and resistance to antiangiogenic therapy. Nat. Rev. Clin. Oncol. 2009;6:327–338 doi: 10.1038/nrclinonc.2009.63.
4. Kurland BF, Gerstner ER, Mountz JM, et al. Promise and pitfalls of quantitative imaging in oncology clinical trials. Magn. Reson. Imaging 2012;30:1301–1312 doi: 10.1016/j.mri.2012.06.009.
5. Huang W, Chen Y, Fedorov A, et al. The Impact of Arterial Input Function Determination Variations on Prostate Dynamic Contrast-Enhanced Magnetic Resonance Imaging Pharmacokinetic Modeling: A Multicenter Data Analysis Challenge. Tomography 2016;2:56–66 doi: 10.18383/j.tom.2015.00184.
6. Cuenod CA, Balvay D. Perfusion and vascular permeability: Basic concepts and measurement in DCE-CT and DCE-MRI. Diagn. Interv. Imaging 2013;94:1187–1204 doi: 10.1016/j.diii.2013.10.010.
7. Hutterer M, Hattingen E, Palm C, Proescholdt MA, Hau P. Current standards and new concepts in MRI and PET response assessment of antiangiogenic therapies in high-grade glioma patients. Neuro. Oncol. 2015;17:784–800 doi: 10.1093/neuonc/nou322.
8. Wen PY, Macdonald DR, Reardon DA, et al. Updated response assessment criteria for high-grade gliomas: Response assessment in neuro-oncology working group. J. Clin. Oncol. 2010;28:1963–1972 doi: 10.1200/JCO.2009.26.3541.
9. Shukla-Dave A, Obuchowski NA, Chenevert TL, et al. Quantitative imaging biomarkers alliance (QIBA) recommendations for improved precision of DWI and DCE-MRI derived biomarkers in multicenter oncology trials. J. Magn. Reson. Imaging 2019;49:e101–e121 doi: 10.1002/jmri.26518.
10. Guo Y, Lingala SG, Bliesener Y, Lebel RM, Zhu Y, Nayak KS. Joint arterial input function and tracer kinetic parameter estimation from undersampled dynamic contrast-enhanced MRI using a model consistency constraint. Magn. Reson. Med. 2018;79:2804–2815 doi: 10.1002/mrm.26904.
11. Shanbhag DD, Gupta SN, Rajamani KT, Zhu Y, Mullick R. A generalized methodology for detection of vascular input function with dynamic contrast enhanced perfusion data. In: Proc. Intl. Soc. Mag. Reson. Med. Vol. 20. ; 2012. p. 3524.
12. Jacobs M, Benovoy M, Chang L-C, Arai AE, Hsu L-Y. Evaluation of an automated method for arterial input function detection for first-pass myocardial perfusion cardiovascular magnetic resonance. J. Cardiovasc. Magn. Reson. 2016;18:17 doi: 10.1186/s12968-016-0239-0.
13. Chan SLS, Gal Y. Automatic Detection of Arterial Voxels in Dynamic Contrast-Enhanced MR Images of the Brain. In: International Conference on Digital Image Computing Techniques and Applications (DICTA). ; 2012. pp. 1–7. doi: 10.1109/DICTA.2012.6411710.
14. Klawer EME, van Houdt PJ, Simonis FFJ, et al. Improved repeatability of dynamic contrast-enhanced MRI using the complex MRI signal to derive arterial input functions: a test-retest study in prostate cancer patients. Magn. Reson. Med. 2019:1–12 doi: 10.1002/mrm.27646.
15. Sourbron SP, Buckley DL. Classic models for dynamic contrast-enhanced MRI. NMR Biomed. 2013;26:1004–1027 doi: 10.1002/nbm.2940.
16. Barnes SR. Gpufit. https://github.com/ironictoo/Gpufit. Accessed October 16, 2019.
17. Lebel RM, Guo Y, Zhu Y, et al. The comprehensive contrast-enhanced neuro exam. In: Proceedings 23th Scientific Meeting, International Society for Magnetic Resonance in Medicine, Toronto. ; 2015. p. 4456.
18. Just N. Improving tumour heterogeneity MRI assessment with histograms. Br. J. Cancer 2014;111:2205–2213 doi: 10.1038/bjc.2014.512.
19. RSNA QIBA Profiles. http://qibawiki.rsna.org/index.php/Profiles. Accessed November 5, 2019.
20. Bang OY, Chung JW, Son JP, et al. Multimodal MRI-based triage for acute stroke therapy: Challenges and progress. Front. Neurol. 2018;9:1–9 doi: 10.3389/fneur.2018.00586.
Figures


