1519
Assessment of Approximated Analytical B1+ Correction Method for prostate DCE-MRI with Multiple Noise Levels and in 3.0 T Systems1Department of Radiological Sciences, University of California, Los Angeles, Los Angeles, CA, United States, 2Physics and Biology in Medicine IDP, University of California, Los Angeles, Los Angeles, CA, United States, 3Ming Hsieh Department of Electrical Engineering, University of Southern California, Los Angeles, CA, United States
Synopsis
B1+ correction is essential for quantitative prostate DCE-MRI. A simplified approximated analytical B1+ correction method was proposed previously, and we assess this method on a digital reference object (DRO) with various SNR levels and on 110 in-vivo cases from two 3.0 T systems. We find that the approximated analytical B1+ correction method achieves comparable performance to conventional correction method with substantially reduced computation. The approximated analytical correction method is simple and practical for application in the clinic.
INTRODUCTION
Dynamic contrast-enhanced MRI reveals tissue vasculature properties and is useful for the diagnosis and monitoring of prostate cancer1. Quantitative analysis is mainly comprised of MRI signal modeling to generate the contrast agent concentration vs. time curve and pharmacokinetic (PK) modeling to generate Ktrans and ve maps. Accurate quantification is challenging due to many factors, including B1+ inhomogeneity. B1+ inhomogeneity leads to flip angle variation and is known to introduce significant error into the quantification results2. Even when B1+ estimates are available, B1+ correction can be computationally burdensome. Recently we proposed an approximated analytical B1+ correction method3, and have validated it in simulation and with a digital reference object (DRO)4. Here, we further evaluate this B1+ correction method on DRO with various SNR levels and on 110 in-vivo cases and compare it with conventional numerical correction method5.METHODS
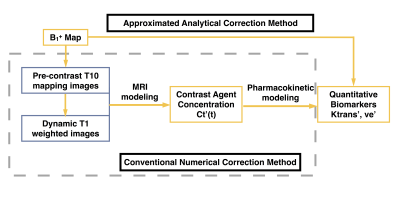
As described previously3, we proposed an approximated analytical B1+ correction method which only takes the B1+ map and uncorrected PK maps as the input. It is easy to implement and can reduce the computation time. The comparison between proposed approximated correction and conventional numerical correction is shown in Fig. 1.
To evaluate our proposed method, we created a prostate-specific digital reference object (DRO) based on the RSNA Quantitative Imaging Biomarkers Alliance (QIBA) project with our clinical protocol4. The DRO comprised of a series of realistic ground truth Ktrans (ranged from 0.01 to 0.35 min-1) and ve (ranged from 0.01 to 0.5). Noise was added to each DRO images using the equation , which is similar to QIBA DRO v96. R is the original signal, and r1 and r2 are noise with mean zero and standard deviation ranging from 5 to 150. The resulting baseline SNR of the DCE signal is from 7.8 to 234.5. With noise added in all DRO images, B1+ corrected PK maps using two correction methods were calculated for each noise level, and both correction methods were evaluated using mean percentage error compared to the ground truth PK parameters.
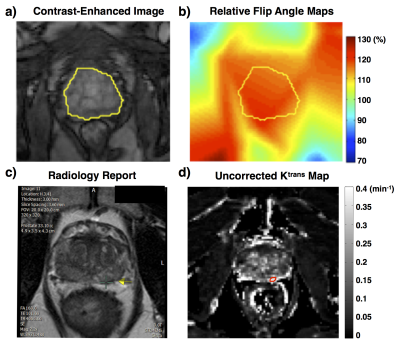
With IRB approval, 110 prostate patients acquired from two 3.0T systems (MAGNETOM Skyra and MAGNETOM Trio, Siemens Medical Systems) were retrospectively selected to evaluate the approximated analytical correction by comparing with the conventional numerical correction. For each case, relative flip angle maps were generated based on RR-VFA method7,8, and three Ktrans and ve maps were calculated (uncorrected, approximated analytically corrected, and numerically corrected). Due to data availability, volumetric regions of interest (ROI) of the prostate region were defined for 82 cases, and the lesions on another 28 cases from the same RF system were contoured based on radiology report, as shown in Fig. 2. The approximated analytical correction method was evaluated using percentage error compared to the numerical corrected PK maps. All post-processing was implemented using an in-house script written in Matlab (Mathworks, Inc., Natick, MA, USA). Estimation parameters (Ktrans or ve) larger than 1 were excluded as outliers9.
RESULTS and DISCUSSION
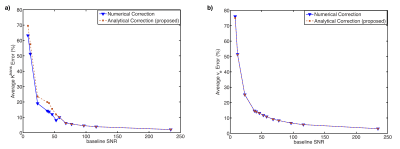
In the DRO experiment, the correction error with different levels of baseline SNR is shown in Fig. 3. Both correction errors decrease with increased baseline SNR level, and the difference between two correction methods is minimal compared to noise-induced correction error. Also, the numerical correction error has a minimum of 2.1%±4.3% with the maximum SNR of 234.5 in the simulation, which gives the correction uncertainty from noise.
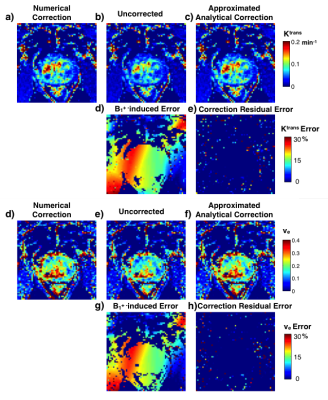
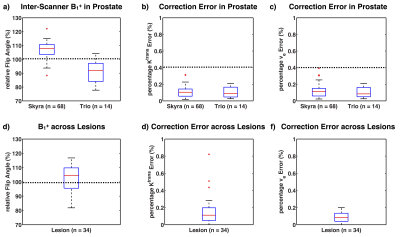
Fig. 4 shows an example in-vivo case with PK maps and error maps. The error induced by the approximation is negligible compared to error induced by B1+ variation. Among the 82 cases, the percentage error of the approximated analytical correction is 0.11±0.27% for Ktrans, and 0.11±0.38% for ve. Fig. 5 shows the B1+ distribution and the approximated analytical correction error for both prostate ROI and lesion ROI. The B1+ patterns between two scanners (Fig. 5a) are significantly different (p < 0.05), indicating the necessity of B1+ correction for comparison between scanners. Similarly, within lesion ROIs, the average B1+ varies from 81.8% to 116.8%, showing the necessity for B1+ correction for lesion characterization. For all the evaluations, the Ktrans and ve errors are less than 0.4%, which is much smaller than the noise-induced uncertainty. Additionally, our proposed correction method computationally took 0.01s for a typical 3D volume cases, while the conventional correction methods took more than 3 hours with our implementation. Our proposed correction method can be a good alternative under some condition regarding computation efficiency.
CONCLUSION
The approximated analytical correction method gives comparable results to conventional numerical correction. This is a practical alternative to conventional B1+ correction for prostate DCE-MRI.Acknowledgements
This work was supported in part by the Integrated Diagnostics Program, Departments of Radiological Sciences at UCLA.References
1. Franiel T, Hamm B, Hricak H. Dynamic contrast-enhanced magnetic resonance imaging and pharmacokinetic models in prostate cancer. European Radiology. 2011;21:616–626.
2. Di Giovanni P, Azlan CA, Ahearn TS, Semple SI, Gilbert FJ, Redpath TW. The accuracy of pharmacokinetic parameter measurement in DCE-MRI of the breast at 3 T. Physics in Medicine and Biology. 2010;55(1):121–132.
3. Zhong X, Rangwala N, Raman S, Margolis D, Wu H, Sung K. B1+ Inhomogeneity Correction for Estimation of Pharmacokinetic Parameters through an Approximation Approach. Proceedings 24th Scientific Meeting, International Society for Magnetic Resonance in Medicine. 2016:2491.
4. Zhong X, Wu H, Nayak K, Sung K. Evaluation of Approximation Method for B1+ Correction using Digital Reference Object in Prostate DCE-MRI. Proceedings 25th Scientific Meeting, International Society for Magnetic Resonance in Medicine. 2017:622.
5. Bedair R, Graves MJ, Patterson AJ, McLean MA, Manavaki R, Wallace T, Reid S, Mendichovszky I, Griffiths J, Gilbert FJ. Effect of Radiofrequency Transmit Field Correction on Quantitative Dynamic Contrast-enhanced MR Imaging of the Breast at 3.0 T. Radiology. 2015;279(2):150920.
6. QIBA Content | Daniel P. Barboriak Lab. https://sites.duke.edu/dblab/qibacontent/
7. Sung K, Saranathan M, Daniel BL, Hargreaves BA. Simultaneous T 1 and B 1 + Mapping Using Reference Region Variable Flip Angle Imaging. Magnetic Resonance in Medicine. 2013;70(4):954–961.
8. Rangwala NA, Dregely I, Wu HH, Sung K. Optimization and evaluation of reference region variable flip angle (RR-VFA) B1+ and T1 Mapping in the Prostate at 3T. Journal of Magnetic Resonance Imaging. 2017;45(3):751–760.
9. Peng Y, Jiang Y, Yang C, Brown JB, Antic T, Sethi I, Schmid-Tannwald C, Giger ML, Eggener SE, Oto a. Quantitative analysis of multiparametric prostate MR images: differentiation between prostate cancer and normal tissue and correlation with Gleason score--a computer-aided diagnosis development study. Radiology. 2013;267(3):787–796.
Figures
