4856
Comparison of Renal Blood Flow Measurements obtained using ASL-MRI and CT Perfusion1University of Southern California, Los Angeles, CA, United States, 2Mayo Clinic, Rochester, MN, United States
Synopsis
Computed tomography perfusion (CTP) is a validated method for assessment of single-kidney renal blood flow (RBF), but is limited by the use of exogenous contrast (i.e. iodine) injection and ionizing radiation. Arterial Spin Labeling (ASL)-MRI is an emerging technique that quantitatively measures RBF without any contrast agents or ionizing radiation. We compared renal perfusion (RBF/gram tissue) obtained using CTP and ASL-MRI in the left and right cortex and medulla of the same pigs (n=6), and observed a linear fit of ASL-MRI = 0.24*CTP+0.42 ml/ml/min with correlation r2=0.71.
Introduction
Renal blood flow (RBF) is used to evaluate renal function1. Computed tomography perfusion (CTP) is a previously-validated method for measuring renal perfusion2. This technique uses ionizing radiation and contrast agents, and is not preferable for long-term monitoring of disease or transplant acceptance. ASL-MRI is a non-contrast, non-ionizing method that is capable of measuring perfusion3, but has relatively low signal-to-noise ratio and sensitivity. While both techniques have been assessed individually, we sought to compare them directly. We expected higher CTP values compared to ASL-MRI based on previous studies4,5.Methods
Animal Preparation
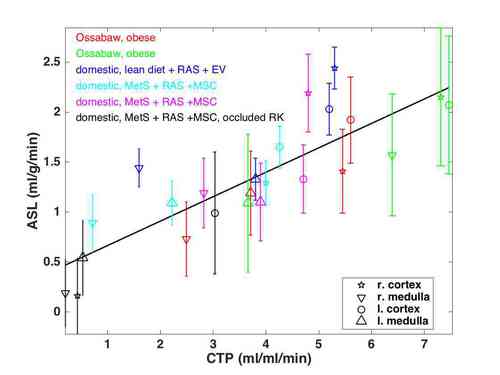
To increase the range of perfusion, ASL-MRI and CTP were performed on 7 swine of different models (figure 1), studied at Mayo Clinic with IACUC approval. Swine were on ventilators to facilitate breath holding. EKG gating was used with ASL-MRI.
CTP Experiment:
CTP experiments were performed as described previously6,7, however, a 128-detector dual-source CT scanner (Somatom Definition Flash, Siemens, Forchheim, Germany) was used instead of a scanner with 64-detectors.
CPT Data Analysis:
CT images were reconstructed and analyzed with the Analyze™ software package (Biomedical Imaging Resource; Mayo Clinic, Rochester, MN) as described previously8,9 to trace cortical and medullary regions of interest (ROIs) in each kidney during the vascular phase. Time-attenuation data derived from the ROIs were plotted and fitted using MATLAB® (R2015b, MathWorks Inc., Natick, MA) to calculate perfusion from curve-fit parameters.
ASL-MRI Experiment:
ASL-MRI experiments were performed on a 3.0T GE Signa HDxt scanner. The ASL-MRI acquisition and analysis followed Zun et al [6] with two modifications: 1) twelve control and tagged pairs were obtained and 2) ROIs for medulla and cortex were matched to those in CTP analysis.
ASL-MRI Data Analysis:
Data analysis was performed in MATLAB. Linear fits were applied to the mean of the ASL-MRI data and CTP data in the following groups: all values together, or medulla, cortex, left, and right individually. R2 values obtained are reported for each group. Bland-Altman analysis was performed using CTP as reference and ASL-MRI as experimental data.
Results
One data set was excluded because of aliasing over the kidney in the slice prescription of ASL-MRI. Figure 1 shows perfusion values for remaining swine. Error bars represent ±1 standard deviation of physiological noise for ASL-MRI. In one domestic swine with severe right renal artery stenosis (RAS) (black, Figure 1), noticeably lower perfusion was detected by both ASL-MRI and CTP.
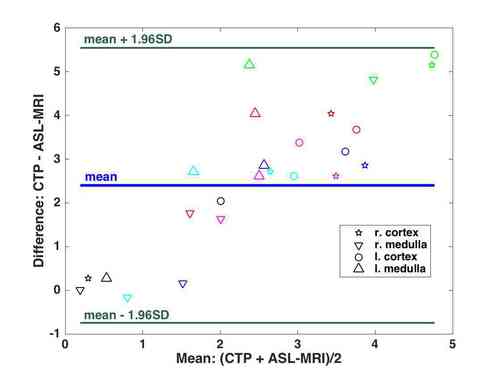
Figure 2 displays Bland-Altman analysis for ASL-MRI and CTP with the same color code as figure 1. Mean difference is 2.4 and 95% limits of agreement are -0.75 and 5.55 ml/ml/min.
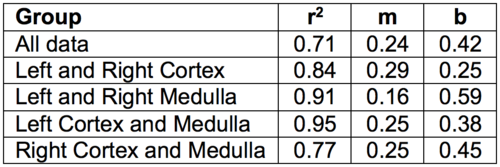
Table 1 lists the r2 value, slope m, and intercept b for linear fits of each data group; all data, left and right cortex, left and right medulla, left kidney only, and right kidney only. The r2 value of all data is 0.71, and is higher in each sub group. M and b range from 0.16-0.29 and 0.38-0.59, respectively.
Discussion
Excluding the swine with a highly obstructed artery, the average ASL perfusion values (1.85±0.40 ml/g/min in cortex and 1.16±0.25 ml/g/min in medulla) are comparable to the reported average literature values (2.01±0.45 ml/g/min in cortex and 1.01±0.21 ml/g/min in medulla)3,4. Average CTP values (5.4±1.2 ml/ml/min in cortex and 3.1±1.6 ml/ml/min in medulla) were within the standard deviation of literature values for healthy swine (4.4±1.2 ml/ml/min in cortex and 3.5±1.4 ml/ml/min in medulla)5.
Bland-Altman analysis shows underestimation of perfusion by ASL-MRI compared to CTP measurements, which tends to increase at high flow rates. These observations are consistent with those of N. Artz et al.4 who reported that ASL-MRI provides consistently lower RBF compared to microspheres. Despite consistent bias, good correlation between two methods was observed in this study (r2=0.71). The low number of subjects, physiological noise in ASL-MRI10, and different chosen slices between scans are possible confounding factors.
Conclusion
ASL-MRI is a viable method for safe measurement of renal perfusion, and correlates well with invasive and ionizing CTP, despite underestimation. It is not clear why underestimation of ASL-MRI increases at high flow rates, however these findings support a “saturation point” mentioned in the literature4, where ASL-MRI was unable to detect proportionally higher flow rates above a certain point.
Future studies are needed to improve the comparison between ASL-MRI vs. CTP and to reduce error. One way to ensure the same imaging slice and ROIs are analyzed in both modalities is by collecting T1-weighted images of the kidneys, which provide better contrast for delineating cortical and medullary ROIs. In ASL-MRI, other tagging schemes and background suppression can be explored to lower physiological noise.
Acknowledgements
This work was supported in part by the National Institutes of Health #R01-HL130494 and Wallace H. Coulter Foundation.References
[1] J. P. Vallee et al. Absolute renal blood flow quantification by dynamic MRI and Gd-DTPA. Eur. Radiol: Vol. 10:p. 1245-1252, 2000.
[2] N. Grenier et al, Rad. Img. Of Renal Structure and Function by CT, MRI, and Ultrasound, Seminars in Nuclear Medicine, Vol. 41(1):p.45-60, 2011
[3] W.C. Wu et al, Renal Perfusion 3-T MR imaging, Radiology: Vol. 261(3): p. 845-853 2011
[4] N. Artz et al. Comparing Kidney Perfusion using Noncontrast Arterial Spin Labeling MRI and Microsphere Methods in an Interventional Swine Model, Invest Radiol., Vol. 46(2):p. 124-131, 2011
[5] Eirin A, Ebrahimi B, Zhang X, et al. Changes in Glomerular Filtration Rate after Renal Revascularization Correlate with Microvascular Hemodynamics and Inflammation in Swine Renal Artery Stenosis. Circulation Cardiovascular interventions., Vol. 5(5):p. 720-728, 2012
[6] Chade AR, Rodriguez-Porcel M, Grande JP, Krier JD, Lerman A, Romero JC, et al. Distinct renal injury in early atherosclerosis and renovascular disease. Circulation. 2002
[7] Chade AR, Rodriguez-Porcel M, Grande JP, Zhu X, Sica V, Napoli C, et al. Mechanisms of renal structural alterations in combined hypercholesterolemia and renal artery stenosis. Arterioscler Thromb Vasc Biol. Vol. 23:p. 1295–301, 2003
[8] Daghini E, Primak AN, Chade AR, et al. Assessment of renal hemodynamics and function in pigs with 64-section multidetector CT: comparison with electron-beam CT. Radiology. Vol. 243(2):p. 405–412, 2007
[9] Krier JD, Ritman EL, Bajzer Z, Romero JC, Lerman A, Lerman LO. Noninvasive measurement of concurrent single-kidney perfusion, glomerular filtration, and tubular function. Am J Physiol Renal Physiol, Vol. 281(4):p. F630–F638, 2001
[10] Z. Zun et al. Assessment of Myocardial Blood flow (MBF) in Humans using Arterial Spin Labeling (ASL): Feasibility and Noise Analysis, Magn. Res. Med., Vol. 62: p.975-983, 2009
Figures