1878
Physiologically synchronized multi-module pulsed arterial spin labeled (SymPASL) MRI1Physics and Astronomy, University of Southern California, Los Angeles, CA, United States, 2Electrical Engineering, University of Southern California, Los Angeles, CA, United States
Synopsis
Physiologically synchronized multi-module pulsed arterial spin labeling (SymPASL) involves pulsed labeling that is applied several times prior to pulsations in the arterial blood supply. Simulations and in vivo measurements in human kidneys demonstrate that SymPASL provides superior SNR and SNR efficiency compared to conventional flow-sensitive alternating inversion recovery (FAIR) ASL with a single labeling pulse. Simulations suggest that SymPASL provides comparable SNR and SNR efficiency to pseudo-continuous ASL (PCASL), with lower specific absorption rate (SAR).
Background
Arterial spin labeling (ASL) is a non-invasive and non-contrast MR method that can quantify regional tissue perfusion. It is extensively used in the brain1, where pseudo-continuous labeling (PCASL)2 is the most widely used approach. Application of ASL to the kidneys and the heart is an active area of research, and the ideal labeling schemes may differ due to the complex geometry of feeding vessels, pulsatile blood supply, quasiperiodic motion, and field inhomogeneity. In the kidneys and the heart, pulsed labeling is most widely used, specifically the flow-sensitive alternating inversion recovery (FAIR) technique3-5. In this work, we demonstrate, through simulation and in vivo experiments, the superior SNR efficiency of using multiple pulsed labeling modules appropriately timed with the cardiac cycle. The proposed technique is termed physiologically synchronized multi-module pulsed ASL (SymPASL).
Methods
Simulation: SymPASL timing is shown in Figure 1. Multiple labeling pulses (red) are applied before image acquisition (blue). Labeling and imaging are triggered based on the time-velocity profile of the arterial blood supply, and the target organ motion pattern, respectively. Buxton’s general kinetic model6 was used to simulate ASL signal (SASL) for PCASL, FAIR, and SymPASL. Simulation parameters were: T1blood = 1932ms7, arterial transit time (ATT) = 1/3 of R-R interval, instantaneous water exchange, bolus duration = 1 R-R. Heart rate = 64 ± 6 bpm and T1tissue = 1584 ± 159ms were measured in vivo. An inversion label was used for FAIR whereas a saturation label was used for SymPASL. A 1500ms labeling duration and 1000ms post-labeling-delay (PLD) were used for PCASL simulation.
Experiment: Six healthy subjects were studied (5M/1F, age 23-30 yrs). Experiments were performed on a 3T scanner (Signa Excite HDxt, GE Healthcare). One FAIR scan with 1 R-R PLD and six SymPASL scans, with 1, 2, 3, 4, 5, and 6 labeling pulses, were performed in all subjects. Each scan was comprised of 6 breath-holds, each comprised of one labeled and one control image. Imaging parameters for both FAIR and SymPASL were: FOV=180-280 mm, slice thickness = 10 mm, flip angle = 50 degrees, matrix size = 96x96, and GRAPPA factor =1.6. Heart rate was recorded in all scans, renal cortex T1tissue was estimated using nonlinear regression from global inversion recovery FAIR data. These values were used as subject specific input parameters for simulation for comparison with in vivo measurement. Labeling efficiency of both FAIR and SymPASL were measured in all subjects.
Analysis: A region of interest (ROI) containing 10-15% (~180 mm2) of the renal cortex within the slice was conservatively drawn to avoid partial volume effects. A reference ROI was drawn on the latissimus dorsi muscle (back muscle). The ASL signal SASL was calculated using SASL = (C-L)/B where C, L, and B are control, labeled, and baseline image. SNR efficiency was defined as SASL/sqrt(2*TR), where SASL is the ASL signal and 2*TR is the total scan time to acquire a pair of control and labeled image8. Physiological noise (PN) was estimated to be the standard deviation of SASL from 6 measurements3. Linear regression was used to compared measured renal blood flow (RBF) quantified from FAIR and 5-label SymPASL.
Results
Figure 2 contains simulation and experimental data from a representative subject. Consistent with simulation, SASL increases with the number of labeling pulses. PN are similar in all scans. SASL and SNR efficiency measured in renal cortex matched with simulation results while measured values in the latissimus dorsi muscle are within the noise level.
Figure 3 shows SASL and SNR efficiency measured from all six subjects in comparison with simulations. Error bars represent the standard deviation across subjects. Renal cortex SASL and SNR efficiency are in good agreement with simulations. Additionally, simulated values from PCASL were added for comparison. It is suggested that SymPASL can provide comparable SASL and SNR efficiency as PCASL but with lower SAR.
Figure 4 shows correlation plot comparing RBF measured from FAIR and SymPASL. A strong correlation (R = 0.93) was found between measured RBF from the two methods. The discrepancy of 0.75 ml/g/min between measured RBF is due to different labeling efficiency and different sensitivity to ATT of the two methods.
Conclusion
This study introduces a variant of pulsed labeling, termed SymPASL, that takes advantage of the pulsatile blood supply. SymPASL provides superior SNR efficiency compared to FAIR, and is likely to be advantageous for 3D ASL of the kidneys and heart. Simulations and in vivo measurements in the human kidneys confirm the advantages of SymPASL over FAIR.
Acknowledgements
American Heart Association 13GRNT13850012;
Wallace H. Coulter Foundation Clinical Translational Research Award;
National Institutes of Health R01-HL130494.
References
1. Alsop, David C., et al. "Recommended implementation of arterial spin-labeled perfusion MRI for clinical applications: A consensus of the ISMRM perfusion study group and the European consortium for ASL in dementia." Magnetic resonance in medicine 73.1 (2015): 102-116.
2. Dai, Weiying, et al. "Continuous flow-driven inversion for arterial spin labeling using pulsed radio frequency and gradient fields." Magnetic Resonance in Medicine 60.6 (2008): 1488-1497.
3. Zun, Zungho, Eric C. Wong, and Krishna S. Nayak. "Assessment of myocardial blood flow (MBF) in humans using arterial spin labeling (ASL): feasibility and noise analysis." Magnetic resonance in medicine 62.4 (2009): 975-983.
4. Zun, Zungho, et al. "Arterial spin labeled CMR detects clinically relevant increase in myocardial blood flow with vasodilation." JACC: Cardiovascular Imaging 4.12 (2011): 1253-1261.
5. Fenchel, Michael, et al. "Perfusion MR Imaging with FAIR True FISP Spin Labeling in Patients with and without Renal Artery Stenosis: Initial Experience." Radiology 238.3 (2006): 1013-1021.
6. Buxton, Richard B., et al. "A general kinetic model for quantitative perfusion imaging with arterial spin labeling." Magnetic resonance in medicine 40.3 (1998): 383-396.
7. Stanisz, Greg J., et al. "T1, T2 relaxation and magnetization transfer in tissue at 3T." Magnetic resonance in medicine 54.3 (2005): 507-512.
8. Guo, Jia, and Eric C. Wong. "Increased SNR efficiency in velocity selective arterial spin labeling using multiple velocity selective saturation modules (mm-VSASL)." Magnetic resonance in medicine 74.3 (2015): 694-705.
9. Reymond, Philippe, et al. "Validation of a one-dimensional model of the systemic arterial tree." American Journal of Physiology-Heart and Circulatory Physiology 297.1 (2009): H208-H222.
Figures
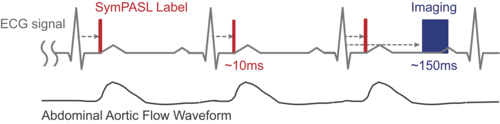
Figure 1. SymPASL sequence timing with labeling pulses (red bars), and imaging (blue box). Both labeling and imaging are ECG-triggered in real-time (dashed gray arrows), with trigger delays optimized depending on the target organ. Labeling pulses are played right before the rise of the abdominal aortic flow waveform (sketched based on Reymond et al.9).
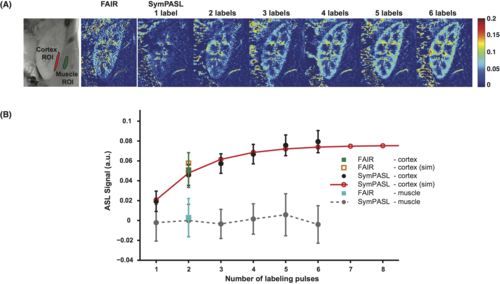
Figure 2. In-vivo evaluation. (A) SASL maps. (B) SASL from ROIs on the renal cortex and latissimus dorsi muscle of a representative subject. Error bars on panel B represent physiological noise (PN), which is defined as standard deviation of 6 measurements. Measured renal cortex SASL is in good agreement with simulation while values on the muscle are within the noise level.
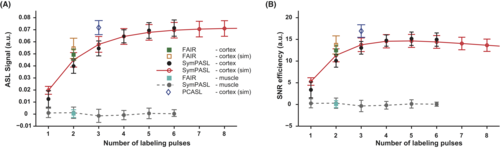
Figure 3. Measured (A) SASL and (B) SNR efficiency from all six subjects in comparison with simulations. Error bars are group standard deviations. SymPASL provides superior SASL and SNR efficiency as compared to FAIR. PCASL simulation (1500ms labeling duration and 1000ms PLD) are shown in blue and are comparable to SymPASL in both SASL and SNR efficiency.
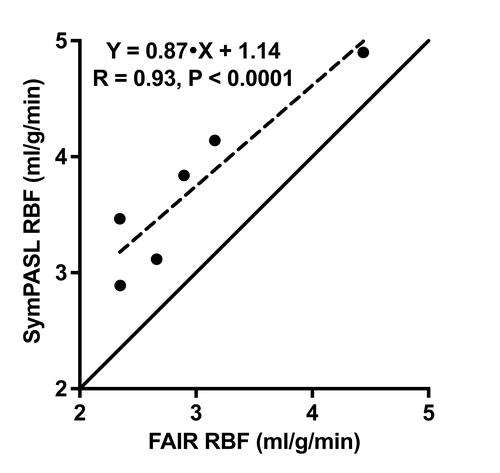
Figure 4. Linear regression plot comparing RBF measured from FAIR and SymPASL. RBF measured from the two methods are strongly correlated (R = 0.93). Measured RBF are 2.98 ± 0.78 and 3.72 ± 0.73 ml/g/min from FAIR and 5-label SymPASL, respectively. There was a bias of 0.75 ml/g/min between the two methods that may be explained by different labeling efficiency and sensitivity to arterial transit time.